2026 Social Media Statistics: An Analysis of Reach, Engagement and Efficiency
Contents
As of early 2026, the digital sphere covers a “supermajority” of the human population, shifting the industry’s focus from raw user acquisition to the maximization of high-utility interaction and commerce conversion.
These social media statistics and data presented herein cover the timeframe from late 2024 through March 2026, capturing the critical period where social platforms successfully challenged traditional search engines and integrated generative AI into the core user experience. This report synthesizes primary disclosures from major platforms and enterprise-level social management organizations to establish current performance benchmarks.
Statistics are sourced exclusively from primary research and official platform reports, including Meta Platforms, Inc., Alphabet Inc., Pew Research Center, Sprout Social, Buffer, Socialinsider, and the Meltwater Global Digital Reports.
2026 Social Media Statistics Summary
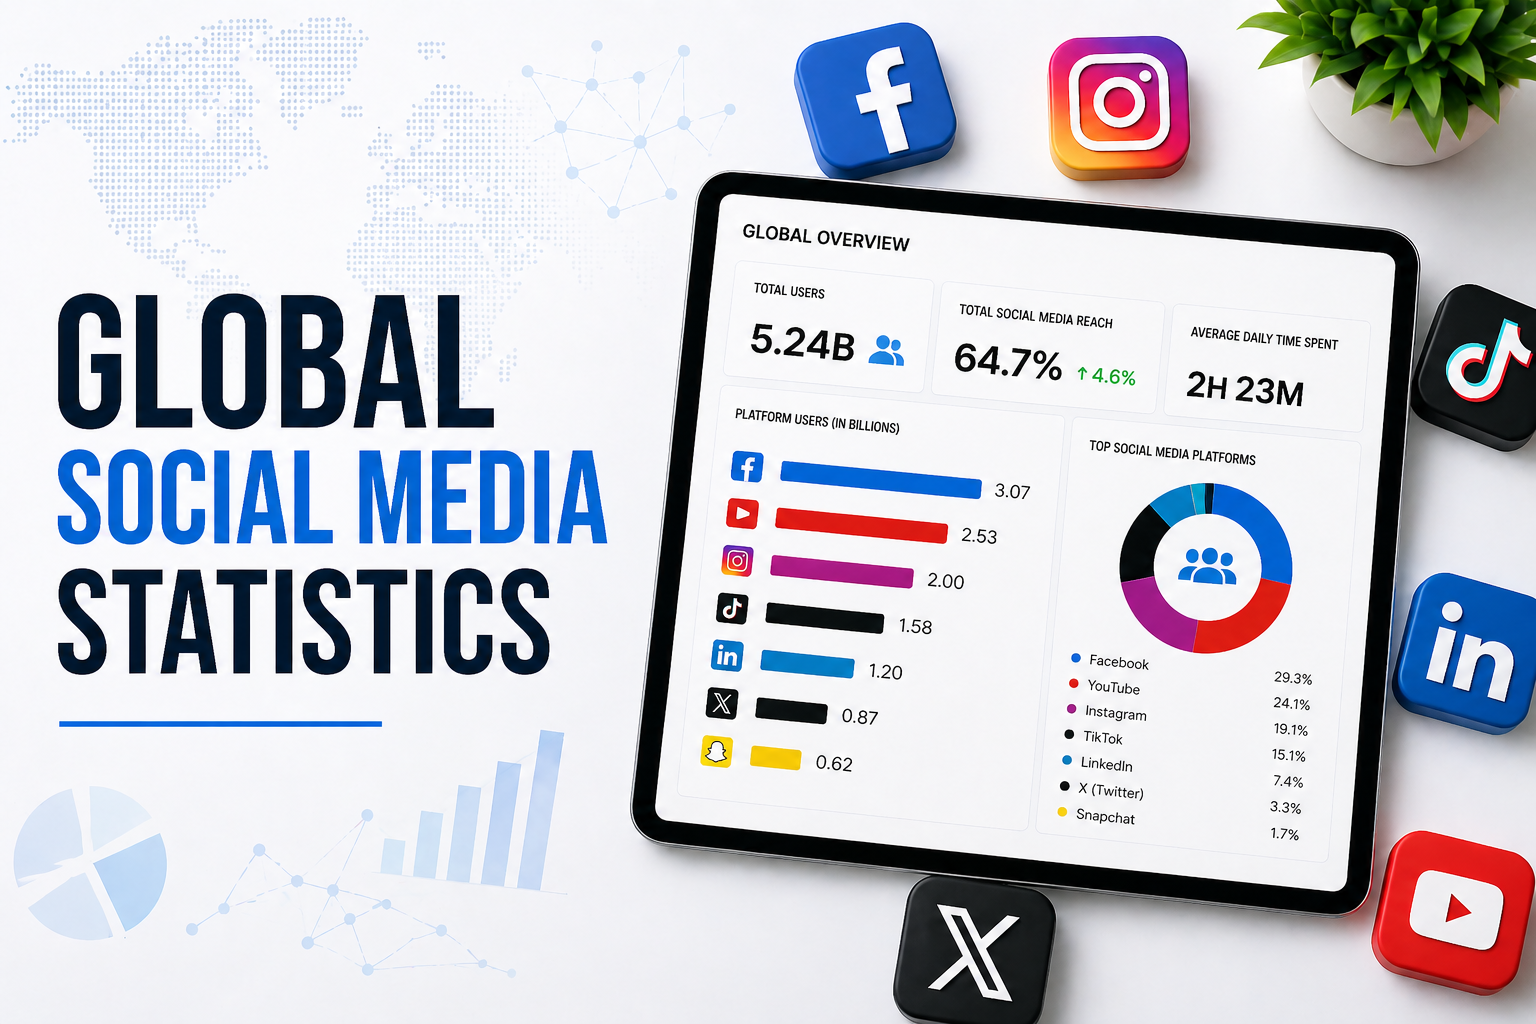
– 5.66 billion active social media users exist worldwide, accounting for approximately 68.7% of the global population.
– 2 hours and 40 minutes is the average time spent daily on social apps, with users typically navigating 6.75 different networks per month.
– 3.73% was the average engagement rate for TikTok in early 2026, reflecting a 49% year-over-year growth in interaction.
– 141.5 million daily active users on Threads officially surpassed X’s 125 million DAU for mobile usage in January 2026.
– 21.77% is the median engagement rate for LinkedIn document carousels, outperforming video and image posts by a factor of 3x.
– 40% of Gen Z users now utilize social platforms like TikTok and Instagram as their primary search engine for local recommendations over traditional search.
– $20 billion in Gross Merchandise Value (GMV) was achieved by TikTok Shop in 2025, a 115% year-over-year increase.
– $200.97 billion in full-year 2025 revenue was reported by Meta, representing a 22% increase driven by AI ad performance.
– 104% more marketers named short-form video their most valuable channel in 2025 compared to 2024.
– 73% of consumers report they will switch to a competitor if a brand fails to respond on social media.
Related: Content Marketing Statistics 2026: 100+ Primary Benchmarks and ROI Analysis
Social Media Statistics Reference Table
| Statistic | Value | Scope | Year | Source |
| Global Social Media Users | 5.66 Billion | Global | 2025 | Statista/Sprout |
| Avg. Daily Time Spent | 2h 40m | Global | 2026 | Sprout Social |
| TikTok Engagement Rate | 3.73% | Global | 2026 | Socialinsider |
| Meta Family DAP | 3.58 Billion | Global | 2025 | Meta IR |
| Meta Annual Revenue | $200.97B | Global | 2025 | Meta IR |
| Alphabet Annual Revenue | $402.8B | Global | 2025 | Alphabet IR |
| YouTube Annual Revenue | $60B+ | Global | 2025 | Alphabet IR |
| Instagram Engagement Rate | 0.48% | Global | 2026 | Socialinsider |
| Facebook Engagement Rate | 0.15% | Global | 2026 | Socialinsider |
| X Engagement Rate | 0.12% | Global | 2026 | Socialinsider |
| LinkedIn Median ER | 6.2% | Global | 2026 | Buffer |
| LinkedIn Document ER | 21.77% | Global | 2026 | Buffer |
| Threads DAU (Mobile) | 141.5M | Global | 2026 | Sprout Social |
Related: AI Adoption Statistics 2026
The Attention Frontier: Social Media Statistics on Algorithmic Efficiency and Discovery
The current engagement landscape is defined by a shift away from the “social graph” toward interest-based recommendation engines. Platforms that leverage AI to surface relevant content regardless of follower status are dominating user retention, creating an environment where “discovery” is the primary user motivation.
– 95 minutes per day is the average global usage for TikTok, which significantly outpaces YouTube’s 40 minutes and Instagram’s 29 minutes.
– Approximately 85% of all video views on TikTok are driven by its recommendation algorithm, compared to only 57% for Instagram’s Explore and Reels systems.
– 5.7% is the average engagement rate for TikTok reported by Searchlab, while Socialinsider measures brand-specific engagement at 3.73%.
– 45% year-over-year growth was recorded in average shares per post on TikTok, even as comments per post fell by 24%, suggesting a move toward private sharing.
– 1.48% is the average engagement rate for Instagram Reels, which generate 36% more reach than carousels.
– 2.25x more people are reached by Instagram Reels than single-image posts, yet carousels earn 109% more engagement per person reached.
Related: AI Job Impact Statistics 2026: Global Labor Market Displacement and Growth Analysis
The Connection
The 227% difference between TikTok’s 95-minute daily usage and Instagram’s 29-minute average illustrates a massive retention gap. When analyzed against the 85% algorithmic view rate, it is mathematically clear that TikTok has successfully decoupled distribution from the follower model, allowing it to maintain a 57.3% DAU/MAU “stickiness” ratio that is currently unmatched in the industry.
Professional and B2B Utility: The Utility Paradigm
B2B engagement in 2026 has moved toward “document-driven” authority. Professional networks are no longer used primarily for resume hosting but as critical hubs for educational product content and industry thought leadership, where deep-dive assets provide the highest measurable ROI.
– 1.3 billion members now belong to LinkedIn globally, with B2B marketers ranking it as their most-used platform in 2025.
– 21.77% median engagement for LinkedIn document carousels (PDF posts) is roughly 3x higher than the engagement for standard video (7.35%) or image posts.
– 2.13% is the average engagement rate for LinkedIn company pages, while personal “thought leader” profiles average between 2.0% and 6.0%.
– 24% of B2B marketers actively use TikTok in 2026, and companies with an active presence receive 3.2x more job applications.
– 6.1% is the average B2B conversion rate for LinkedIn lead-gen ads, the highest in the sector for 2026.
The Connection
The 11-fold efficiency advantage of document carousels (21.77% ER) compared to general tech industry benchmarks (1.95% ER) reveals that professional users prioritize “portable utility” over feed-native updates. This trend suggests that B2B brand equity is now built on the value of the downloadable asset, as 70% of users continue to engage with brand content weekly.
Youth Realities: Messaging, Mental Health, and Parental Disconnect
The way different generations perceive and utilize social media remains a primary source of friction. While teens utilize platforms for entertainment and primary messaging, parents remain significantly more skeptical about the long-term impact on mental health and productivity.
– 57% of U.S. teens message others daily on Snapchat, a rate significantly higher than on TikTok or Instagram.
– 40% of teen TikTok users report that the app hurts their sleep, compared to only 25% for other major platforms.
– Only 28% of teen TikTok users believe they spend too much time on the app, while 44% of parents hold that view.
– 31% of Black teens on TikTok post or share their own media daily, which is nearly twice the rate of White or Hispanic teens.
– 24% of parents believe social media hurts their teen’s mental health, whereas only 8% believe it helps.
Related: AI Job Impact Statistics 2026: Global Labor Market Displacement and Growth Analysis
The Connection
The 16 percentage point gap between parental and teen perceptions of “overuse” (44% vs 28%) highlights a growing psychosocial divide. This is compounded by the fact that 40% of users admit to sleep disruption, which directly supports the 24% of parents citing mental health harms, creating a cycle of regulatory and domestic pressure on platform usage.
Barriers: Regulatory, Legal, and Technical Constraints
– 73% switch rate: Consumers will leave a brand if inquiries on social media go unanswered.
– 12+ state attorneys general are actively pursuing lawsuits against TikTok regarding addictive features and kids’ privacy.
– 71% content struggle: Marketers report that while AI helps create more volume, they are struggling to create content that actually performs.
– Nearly 30% of marketers report decreased organic search traffic as consumers pivot to AI-curated discovery tools.
Synthesis: What These Statistics Suggest Heading into 2027
The 2026 data indicates a “Quality Peak” in the social media life cycle. As AI floods the market with automated content, the “Human Premium” has become the primary differentiator for brand growth. The transition of search behavior—where 40% of younger users bypass traditional engines for social discovery—suggests that platforms are no longer just for connection, but have become the primary interface for the “Internet of Trust”.
For brands, success in 2027 will not be measured by reach, but by the ability to maintain a 73% retention rate through hyper-responsive social customer care and authentic storytelling that cuts through machine-polished noise.
Methodology & Sources
This reference page utilizes primary data from corporate SEC filings (Meta, Alphabet), non-partisan research institutions (Pew Research Center), and proprietary datasets from leading social media SaaS providers (HubSpot, Sprout Social, Buffer, Socialinsider). All engagement metrics are presented as medians or averages as specified.
Works cited
From
120+ Must-know social media marketing statistics for 2026 – Sprout Social, accessed April 28, 2026.
Social Media Benchmarks For 2026 – Socialinsider, accessed April 28, 2026.
TikTok Statistics 2026 | 50+ Facts on Growth, Reach & Ads | Searchlab, accessed April 28, 2026.
Meta Reports Fourth Quarter and Full Year 2025 Results – PR Newswire, accessed April 28, 2026.
State of Marketing 2026 Report: AI, Brand POV & Human-Led Growth | HubSpot, accessed April 28, 2026.
Teens’ Experiences on TikTok, Instagram and Snapchat | Pew …, accessed April 28, 2026.
Racial Differences in How Teens Use Social Media, accessed April 28, 2026.
Meta Reports Fourth Quarter and Full Year 2025 Results, accessed April 28, 2026.
2026 Marketing Statistics, Trends, & Data – HubSpot, accessed April 28, 2026.
The 2026 Social Media Content Strategy Report, accessed April 28, 2026.